Observe your PostgreSQL Metrics with Terraform, InfluxDB and Grafana
In our last adventure, we bootstrapped the Aiven Terraform Provider and deployed a PostgreSQL database with very few lines of code.
Following up with the Aiven Databases and Terraform for Fun and Profit article, we will expand our infrastructure by sending our PostgreSQL metrics to an InfluxDB service and visualize them with Grafana.
If you haven’t gone through the aforementioned article, you can start by setting up a basic Terraform code to spin up a PostgreSQL database in a main.tf file:
variable "aiven_api_token" {
  type = string
}

variable "aiven_project_name" {
  type = string
}

terraform {
  required_providers {
    aiven = {
      source  = "aiven/aiven"
      version = "2.1.12" # check out the latest release in the docs page!
    }
  }
}

provider "aiven" {
  api_token = var.aiven_api_token
}

data "aiven_project" "my_project" {
  project = var.aiven_project_name
}

resource "aiven_pg" "postgresql" {
  project      = data.aiven_project.my_project.project
  service_name = "postgresql"
  cloud_name   = "google-europe-west3"
  plan         = "startup-4"

  termination_protection = true

  pg_user_config {
    pg_version     = 13
    admin_username = "admin"

    pgbouncer {
      autodb_max_db_connections = 200
    }
  }
}

output "postgresql_service_uri" {
  value     = aiven_pg.postgresql.service_uri
  sensitive = true
}
You will also need a file named terraform.tfvars with your authentication token:
aiven_api_token    = "your_access_token_here"
aiven_project_name = "your_project_name_here"
Finally, execute the following commands on your terminal to create the PostgreSQL service:
$ terraform init
$ terraform plan
$ terraform apply
The init configures your local directory as a Terraform project, plan outputs the changes Terraform is about to do and apply applies those changes.
Let’s push PostgreSQL metrics to InfluxDB
Out of the box, Aiven provides metrics like CPU and memory usage for all its products. You can see them under the Metrics section in the Aiven web console.
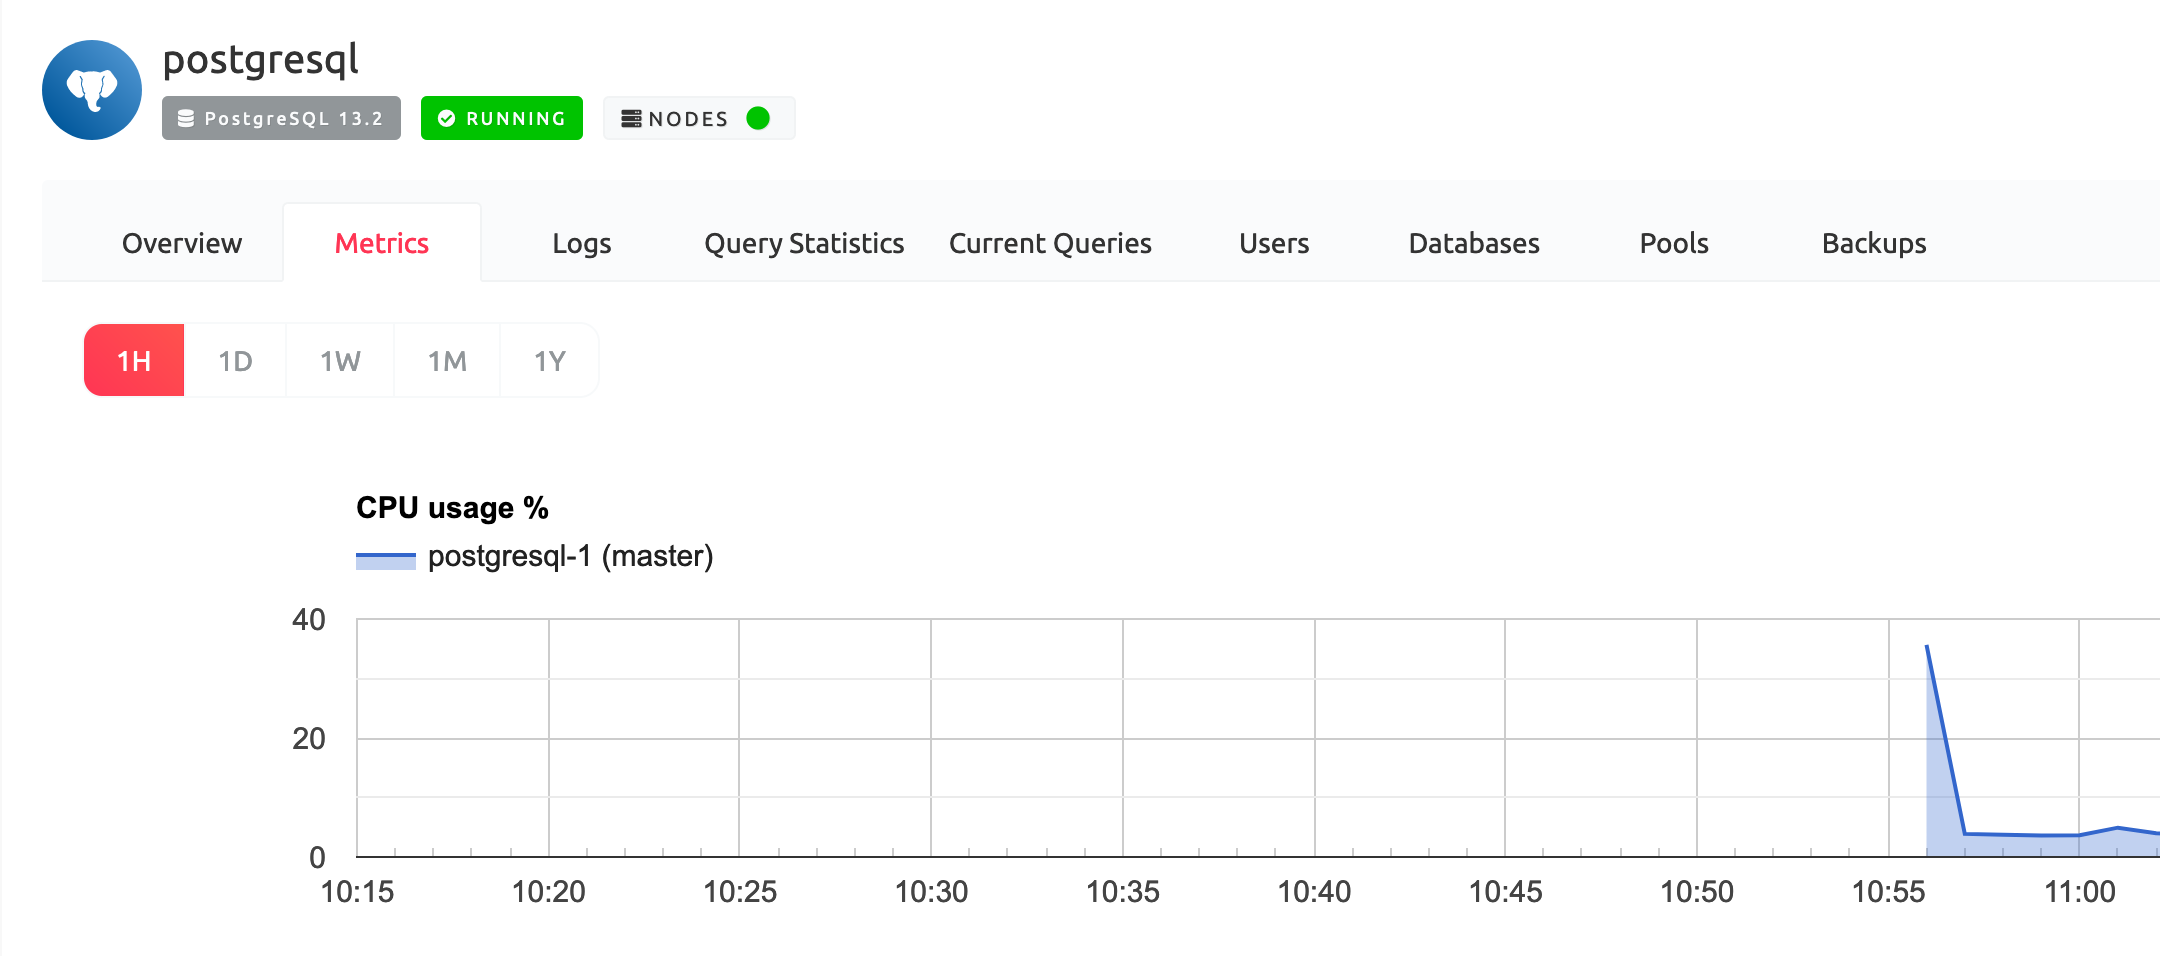
If you need more than that, don’t worry, Aiven has your back. You can push detailed metrics to an Aiven for InfluxDB instance and visualize them with a custom Aiven for Grafana dashboard prebuilt by us, all without leaving your code editor. All of this is possible thanks to the Aiven service integrations that help you integrate Aiven services and external applications to level up your data infrastructure observability.
Start the metrics push by creating an InfluxDB instance, and then integrate it with PostgreSQL metrics. Add the code below in the main.tf file:
resource "aiven_influxdb" "influxdb" {
  project      = data.aiven_project.my_project.project
  cloud_name   = "google-europe-west3"
  plan         = "startup-4"
  service_name = "influxdb"
}

resource "aiven_service_integration" "postgresql_metrics" {
  project                  = data.aiven_project.my_project.project
  integration_type         = "metrics"
  source_service_name      = aiven_pg.postgresql.service_name
  destination_service_name = aiven_influxdb.influxdb.service_name
}
The aiven_influxdb resource creates an InfluxDB instance following the same code pattern as the PostgreSQL already created. The aiven_service_integration resource is responsible for integration between Aiven products. Here it is sending "metrics" from aiven_pg.postgresql to aiven_influxdb.influxdb.
To finish the infrastructure setup, spin up a Grafana instance to visualize the PostgreSQL metrics sent to InfluxDB. Add the last bit of content to the main.tf file:
resource "aiven_grafana" "grafana" {
  project      = data.aiven_project.my_project.project
  cloud_name   = "google-europe-west3"
  plan         = "startup-4"
  service_name = "grafana"

  grafana_user_config {
    public_access {
      grafana = true
    }
  }
}

resource "aiven_service_integration" "grafana_dashboard" {
  project                  = data.aiven_project.my_project.project
  integration_type         = "dashboard"
  source_service_name      = aiven_grafana.grafana.service_name
  destination_service_name = aiven_influxdb.influxdb.service_name
}
After getting used to the Terraform Provider, you can probably guess what is happening above: creating a Grafana instance with aiven_grafana resource and giving it public access within the grafana_user_config block. You can take a peek at the official Aiven for Grafana docs for more options.
The aiven_service_integration resource integrates Grafana with InfluxDB, to read the metrics and show them in a dashboard.
Lastly, let’s output last the Grafana access information, composed of the URI, username and password:
output "grafana_service_uri" {
  value     = aiven_grafana.grafana.service_uri
  sensitive = true
}

output "grafana_service_username" {
  value = aiven_grafana.grafana.service_username
}

output "grafana_service_password" {
  value     = aiven_grafana.grafana.service_password
  sensitive = true
}
It’s showtime. Run the Terraform plan and apply commands to visualize the changes and put our infrastructure in the desired state:
$ terraform plan
$ terraform apply
After deploying, we need to find out the Grafana URL and password to access its interface. As this information is considered sensitive, we need to run the following commands to output it.
First for the URI:
$ terraform output -raw grafana_service_uri
https://grafana-your-project.aivencloud.com:443
And for the password:
$ terraform output -raw grafana_service_password
your_password_output
Open the grafana_service_uri in your browser and log in with the avnadmin username (created by default on every instance) and the grafana_service_password output.
When you get to the main page, navigate to Dashboards > Manage, access the Aiven PostgreSQL - postgresql - Resources and voilà, telemetry heaviness.
We now have metrics about the machine, indexes, databases and many, many more.
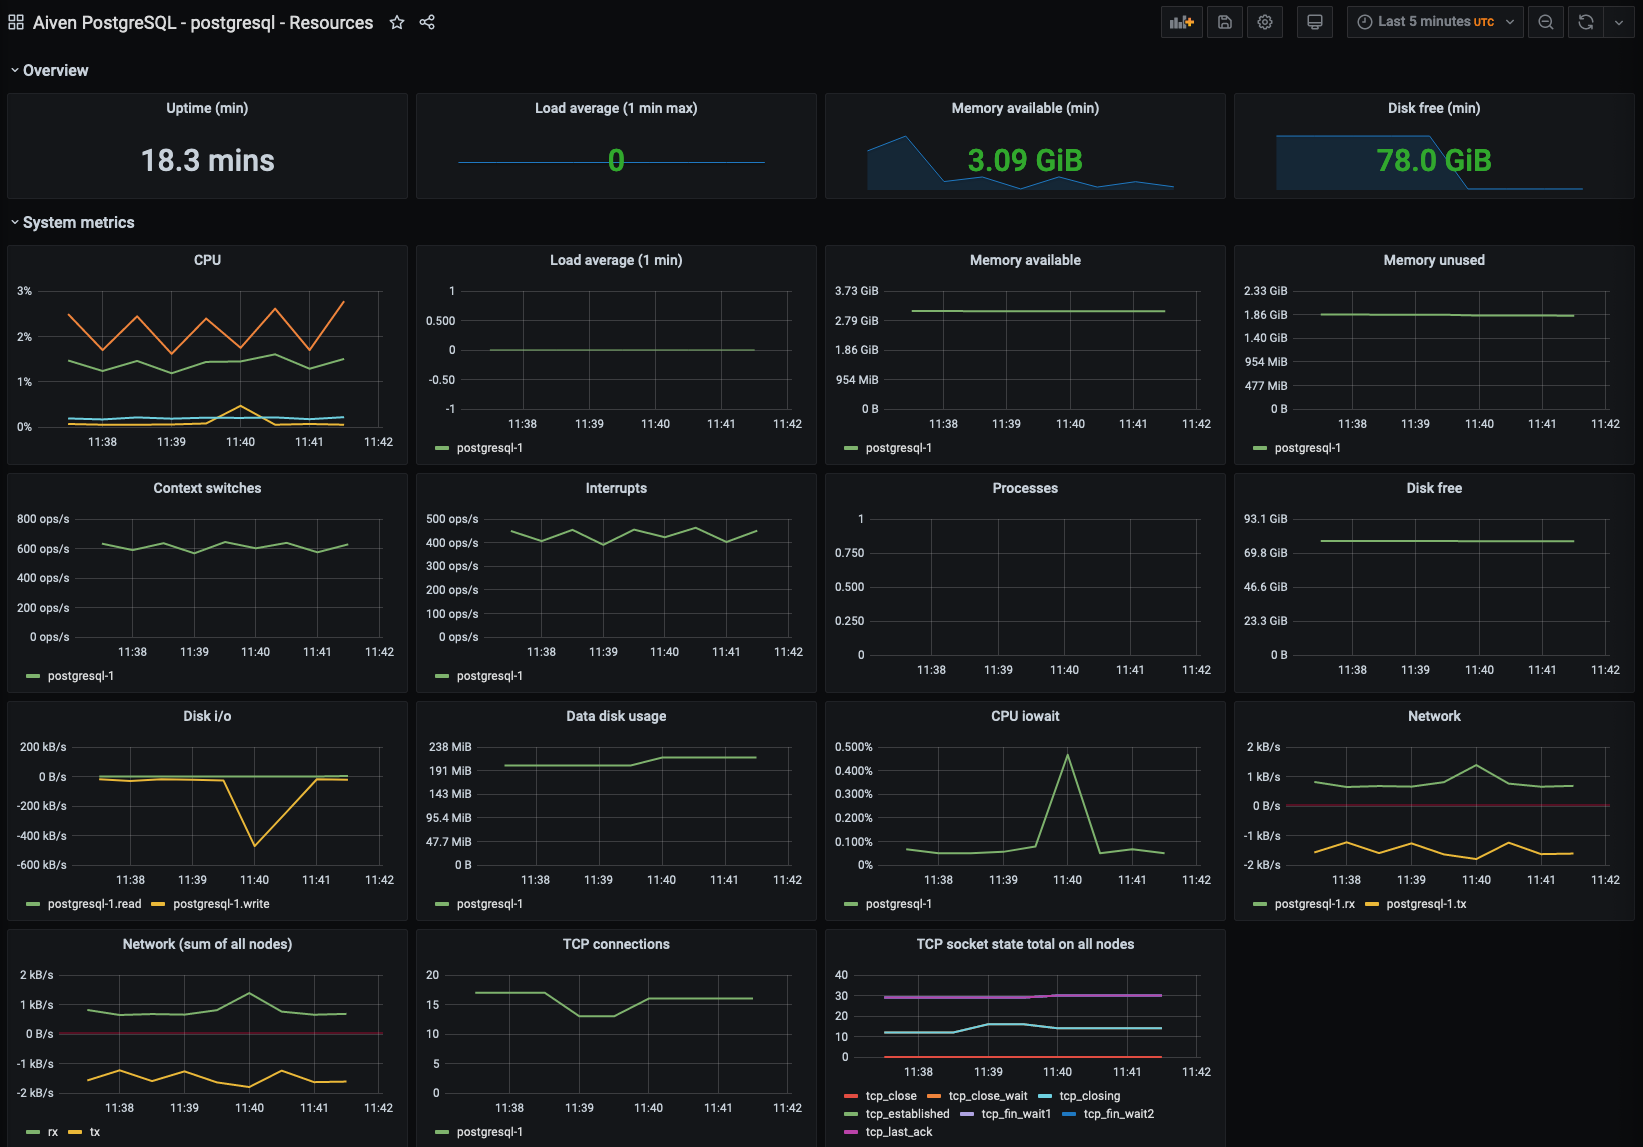
This kind of visibility is extremely important during load testing and performance tuning, as well as creating alerts and understanding your system’s behavior.
Tidy up the Resources When You’re Done
Infrastructure costs money and natural resources. When you’ve finished with the services, you may remove them with Terraform:
$ terraform destroy
Type yes and hit enter. Your whole infrastructure should be gone.
Error: 403: {"errors":[{"message":"Service is protected against termination and shutdown. Remove termination protection first.","status":403}],"message":"Service is protected against termination and shutdown. Remove termination protection first."} -
Oh wait, it seems we got an error 🤔 While Grafana and InfluxDB are gone, the termination_protection flag protected our PostgreSQL resource. To remove it for real, go back to the main.tf file and set the flag to false.
resource "aiven_pg" "postgresql" {
  [...]
  termination_protection = false
  [...]
}
Run the following Terraform apply command to change only the PostgreSQL resource (otherwise it will create the whole infrastructure again):
$ terraform apply --target aiven_pg.postgresql
And, finally, today’s last command:
$ terraform destroy
[...]

Destroy complete! Resources: 1 destroyed.
Terraform and Aiven for IaaS Success
Working with GUIs and CLIs is perfect for most teams and organisations, but infrastructure as code is taking over the way we manage our platforms. Terraform is the current de facto tool to achieve this level abstraction, allowing engineers and operators to collaborate into building and deploying their solutions. And remember, if you need an open source data service, the Aiven Terraform Provider will be there for you.
Wrapping up, and further reading
Please check this GitHub repository to see the whole code and any future updates for it.
If you want to learn more about the tools and services used here, make sure to check the links below:
If you have any comments about Aiven’s Terraform Provider or want to help us improve it, please check the GitHub repository and the official documentation.